Polynomials with Coefficients 1 and -1
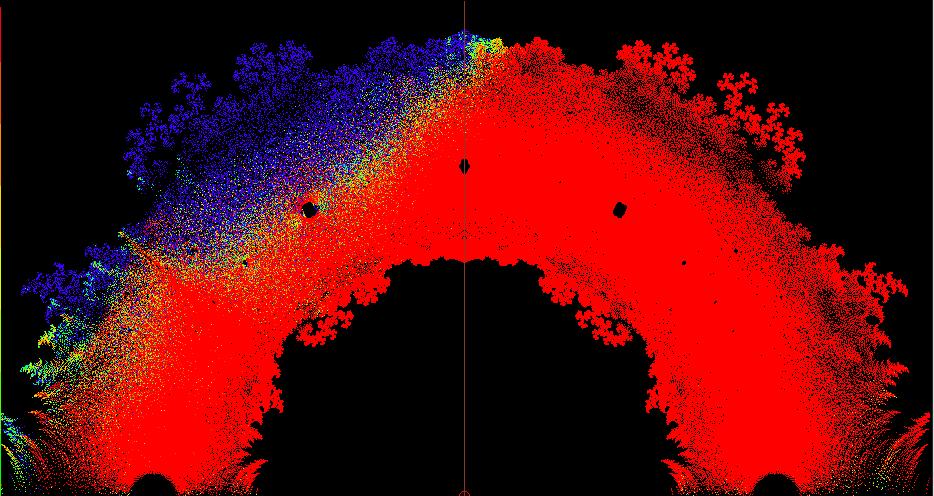
Figure 1a: Sensitivity of zeros for coefficients -1/1 - The zeros colored by their sensitivity to variation in the coefficients of the polynomial. The sensitivity is cumulative over all the coefficients. The color scale represents a normalized sensitivity to the range of values; red is insensitive to violet which is strongly sensitive. All zeros are pictured. The zeros are for coefficients -1 and +1 for polynomial degree 17. |
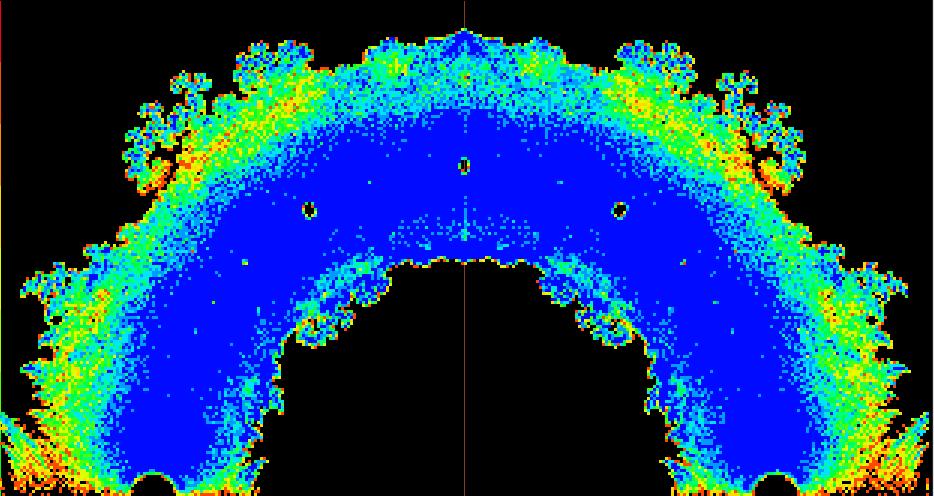
Figure 1b: Density of zeros for coefficients -1/1 - The zeros are colored by their density. The distribution of zeros has been coarsened by collecting them onto a grid, resulting in a slight blockiness. The range of color is normalized to the range of densities; red is low density to blue which is high density. |
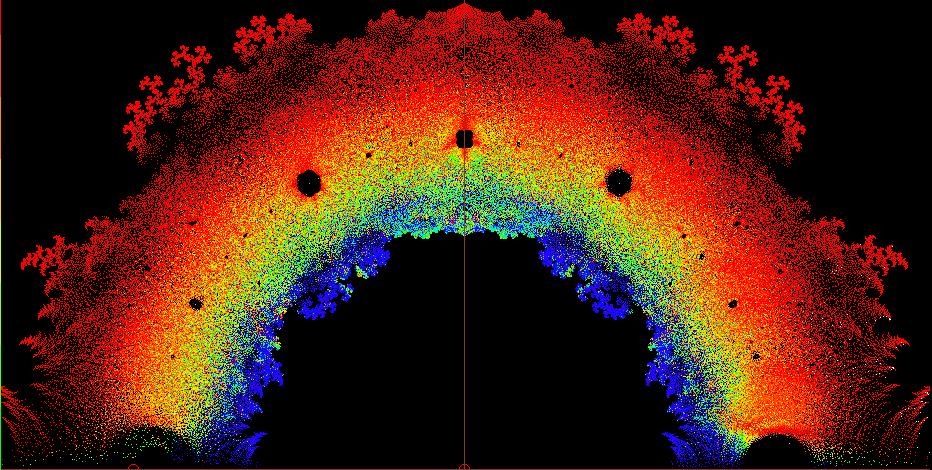
Figure 1c: Sensitivity of zeros relative to coefficient a1 - Figure 1a is reproduced, this time with conditioning relative to the coefficient for x. |
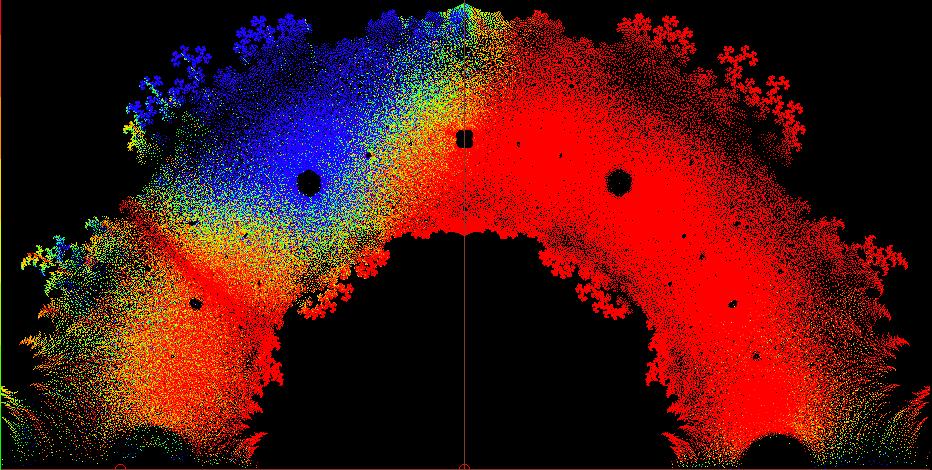
Figure 1d: Sensitivity of zeros relative to coefficient a9 - Figure 1a is reproduced, this time with conditioning relative to the coefficient for x9. |
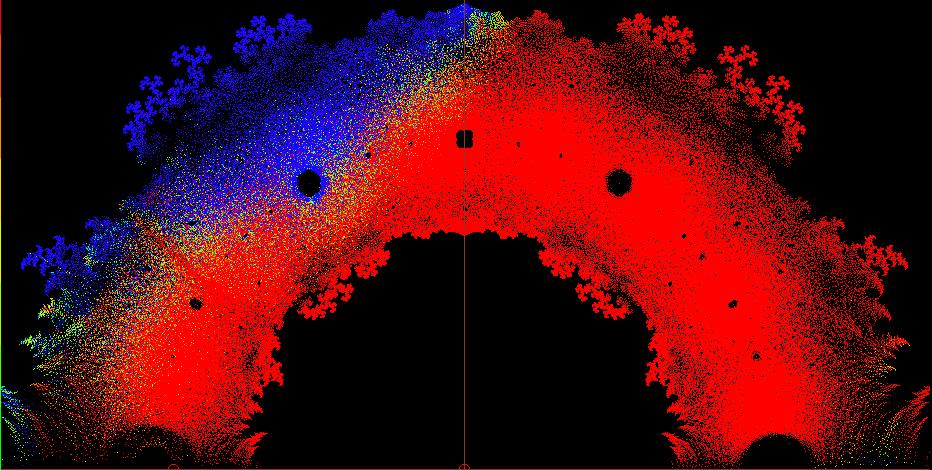
Figure 1e: Sensitivity of zeros relative to coefficient a16 - Figure 1a is reproduced, this time with conditioning relative to the coefficient for x16. |
Series of images for degree 15 with the conditioning for all zeros normalized to a specified maximum. Colors show no sensitivity at red to high sensitivity at blue. Missing zeros correspond to those values greater than the indicated conditioning limit.
Polynomials with Coefficients 1 and 0
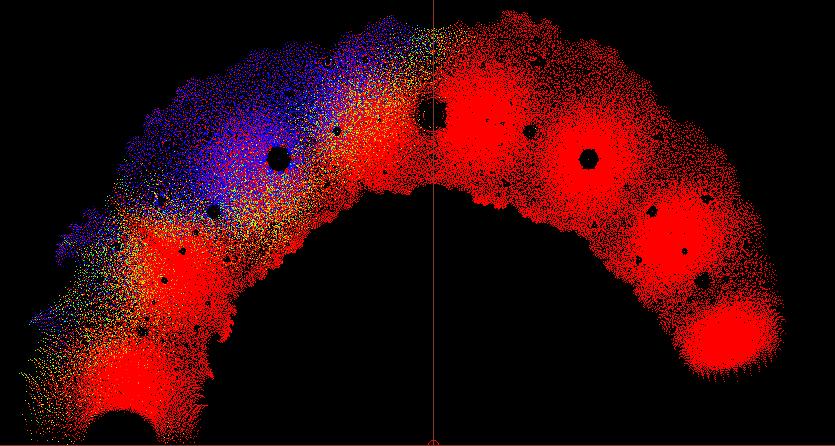
Figure 2a: Sensitivity of zeros for coefficients 0/1 - The zeros colored by their sensitivity to variation in the coefficients of the polynomial. The sensitivity is cumulative over all the coefficients. The color scale represents a normalized sensitivity to the range of values; red is insensitive to violet which is strongly sensitive. All zeros are pictured. The zeros are for coefficients 0 and +1 for polynomial degree 17. |
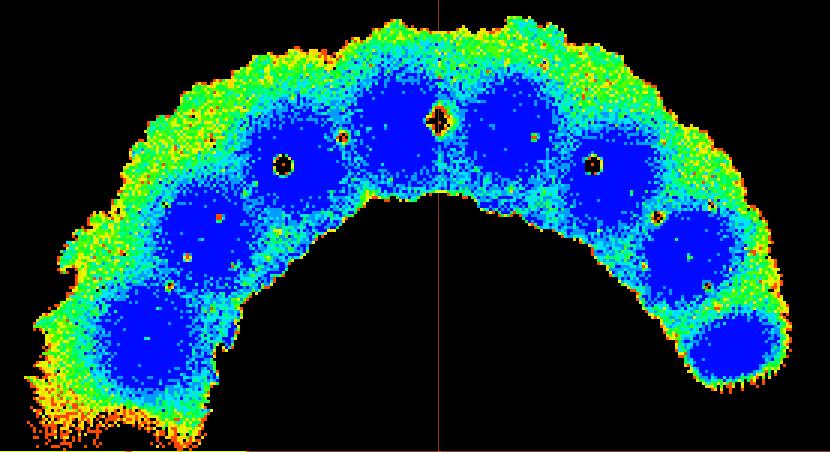
Figure 2b: Density of zeros for coefficients 0/1 - The zeros are colored by their density. The distribution of zeros has been coarsened by collecting them onto a grid, resulting in a slight blockiness. The range of color is normalized to the range of densities; red is low density to blue which is high density. |
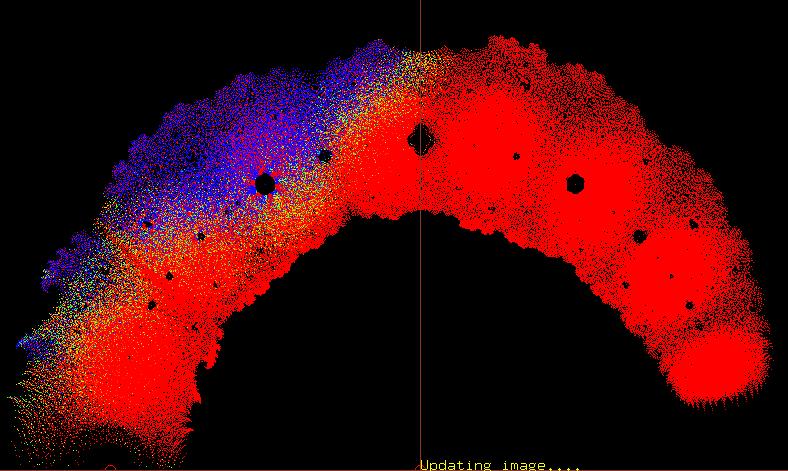
Figure 2c: Sensitivity of zeros relative to coefficient a1 - Figure 1a is reproduced, this time with conditioning relative to the coefficient for x. |
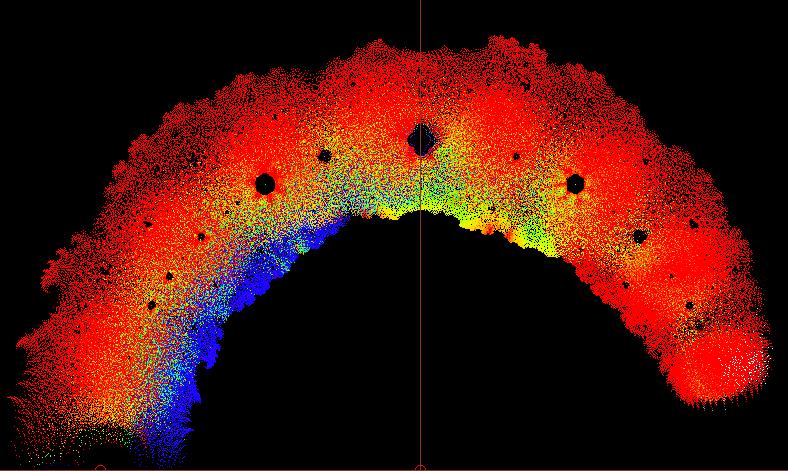
Figure 2d: Sensitivity of zeros relative to coefficient a9 - Figure 1a is reproduced, this time with conditioning relative to the coefficient for x9. |