OpenMath JavaBean Function Plotting Environment Mock-ups
The following two mock-ups respond to a wish-list for a graphing calculator environment that is adapted to the teaching of composition of functions.
Use key pad to enter function to be plotted:
sin
cos
tan
x
1/x
sinh
cosh
tanh
y^x
-
sqrt
ln
log
y^1/x
+
6
7
8
9
/
2
3
4
5
*
0
1
(
)
.
INV
x^2
[
]
=
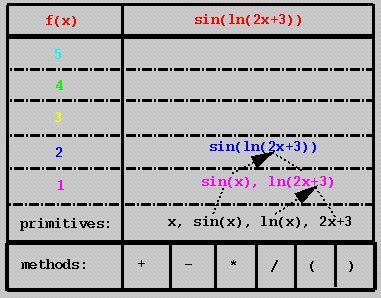
f(x) = sin(ln(2x+3))
Explanation:
The Function Builder:
Primitive functions are defined to be polynomials (in 'x', for now) and trigonometric, logarithmic, and hyperbolic functions of 'x' only. Students would enter a function using the key pad and it would then be displayed using proper mathematical notation in the display space below the key pad. In order to plot the function, the students would need to build it using the function builder to the right of the key pad following these steps:
1. on the lowest level they would type in all of the primitives that relate to the function. (f(x)=x would be present by default).
2. They would then "construct" the function by dragging the "primitives" to higher levels. Methods for constructing the function include the arithmetic operations, grouping through use of brackets, and composition. If the function requires an arithmetic operation, the student will drag it from the methods list. For composition, the student will drag the outer function over the inner function. For example, to construct ln(2x+3), the student will first drag 2x+3 from the list of primitives to level 1 and then drag ln(x) from the list of primitives over 2x+3 at level 1. Ideally, the dragging from one level to a higher level will leave a dotted-line trace and compostion will leave a signature such as the dotted-line with an arrow as illustrated.
Students should:
- be able to plot any function in the function builder by clicking on them. The function should plot in the colour defined for that level.
- be able to plot all the functions at a given level by clicking on the number associated with that level
- be required to define domain and range parameters for the primitives. One way to do this might be to invoke a pop-up box by clicking and holding on the primitive. Values of the domain that students idntify as restruction should appear as a thin, vertical dotted-line (yellow?) on the graph.
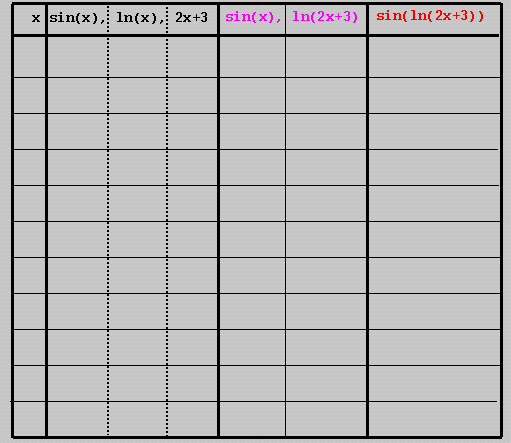
- be able to hide columns in the table of values by horizontal scrolling
- use auto-scaling values or enter their own test points.
Screen Presentation:
- in order to minimize screen clutter, the various components of this tool should be invokable as pop-up windows that can be "hidden" when not in use.
OpenMath JavaBean Function Plotting Environment Mock-up #2
This alternate mock-up combines the function builder with the table of values. Students would drag the "building blocks" of the function into a workspace above the table of values. Colours would be assigned by the applet to indicate different levels of composite functions. Potential problem: how would the applet choose between competing decompositions of a composite fn. ie f(x)=sin(ln(2x+3)) could be thought of as a composition of a composition - with a unique reasonable breakdown or as a simple composition with two possible breakdowns: g1(x) = sin(x), g2(x) = ln(2x+3) or g1(x) = sin(ln(x)), g2(x) = 2x+3. If the applet always parses down to the level of "primitives" and builds the function up from this level, then there should be a unique representation. What about sums/differences of two (possibly composite) functions? How would the applet be able to recognize levels and assign appropriate colours?